51% of supermarket food and drink is packaged in unnecessary plastic
First-of-its kind analysis of 1,500 supermarket groceries reveals the stranglehold that plastic packaging has on food and drink shopping.
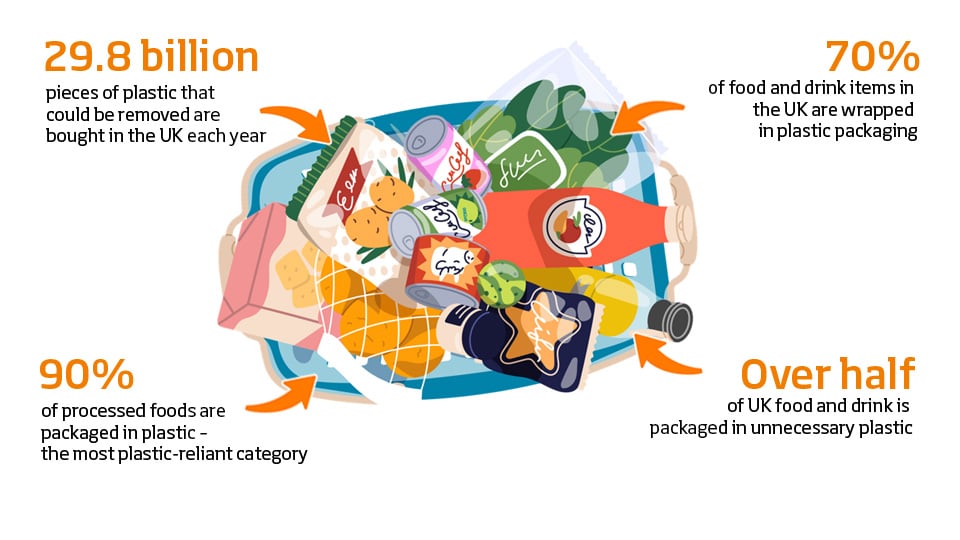
The Material Change Index, which was commissioned by us and conducted by Retail Economics, identified that over half (51%) of food and drink items found in UK supermarkets are unnecessarily1 packaged in plastic that can be safely removed or replaced with alternatives. This adds up to 29.8 billion avoidable pieces annually across the UK.
Download The Material Change Index Report here
Please complete this form and we will contact you with more details about the brochure.
Good progress has been made but there is more to do. Government can and should demand more of us all - phasing out certain plastics to create a level playing field that encourages innovation, investment, and generates healthy competition to replace plastic.
Miles Roberts
Group Chief Executive, DS Smith
Plastic in shopping baskets
The Material Change Index research shows that most of that plastic packaging came from processed foods, including ready-meals and meal kits (90%); bread, rice and cereals (89%); dairy products (83%); and meat and fish (80%).
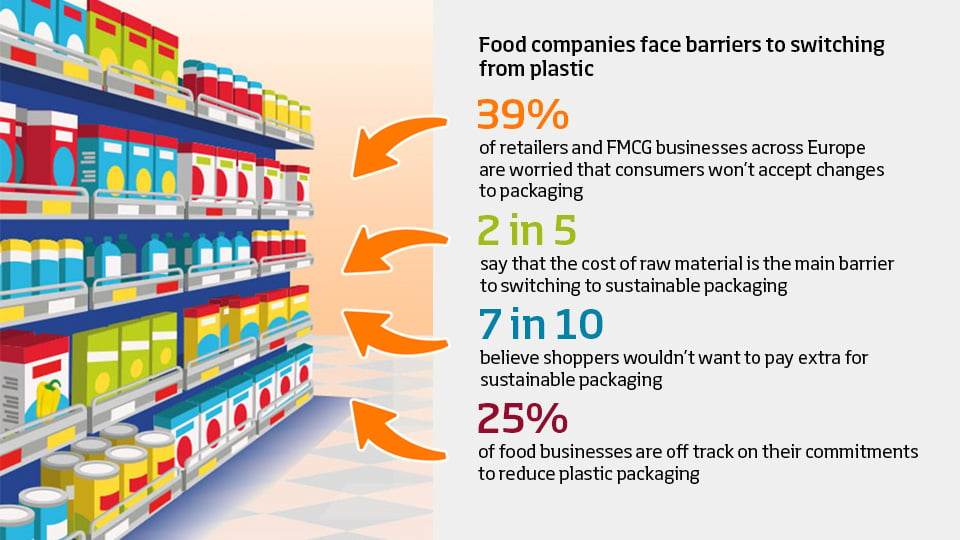
A survey of European food manufacturers and retailers2 carried out as part of the research found that almost all (98%) respondents have commitments to reduce plastic packaging. Three in five (60%) have two years or less left to reach their voluntary targets, but a quarter (25%) say they are off track to reach them. Two in five (40%) identified the cost of raw material as the biggest obstacle, closely followed by the fear that consumers would not accept changes (39%).
Food companies face barriers to switching from plastic
Food manufacturers and retailers worry that shifts in packaging would make them uncompetitive. Seven in ten (72%) believe that shoppers would not want to pay extra for sustainable packaging and nearly two thirds (65%) think they wouldn’t want to sacrifice convenience for sustainability.
The Material Change Index analysed packaging materials in 25 of the most popular supermarkets across six European markets: UK, France, Germany, Italy, Spain and Poland. The findings showed that the UK is the most reliant on plastic packaging, with 70% of all food and drink items on British shelves containing plastic3 compared to Spain (67%), Italy (66%), Germany (66%), Poland (62%) and France (59%).
Over the last four years, we've replaced over 1 billion pieces of plastic, but meeting consumer demand for sustainable packaging is crucial. We hope the Government's Zero Waste Strategy will support the use of more readily recyclable materials.
The research involved a detailed audit of plastic usage in 1,500 food and drink products across the top five food retailers by market share in six European countries: France, Germany, Italy, Spain, Poland and the UK. The approach relied on two key measures:
Basket Analysis – the proportion of routinely purchased items in a typical grocery shopping basket that contain plastic packaging. The basket consisted of fifty items representative of regular food and drink purchases for a typical household across each market, weighted based on the importance of each item in the overall food shop, incorporating retailer market share, consumer spending patterns, and harmonised CPI weightings for each country.
Store Inventory Analysis – the proportion of a range of food and drink items packaged in plastic across different areas of the store. This analysis was weighted by retailer market share and size of store to account for the diversity of products and packaging types available on supermarket shelves.
These were brought together to come up with the overall plastic packaging index. This index provides a weighted average of plastic usage across both a representative shopping basket and product range within stores, delivering a complete picture of plastic use across the food retail landscape in each country.
Unnecessary plastic analysis
Following the store audits, DS Smith’s packaging specialists conducted analysis to determine where plastic packaging could be safely removed or significantly reduced by switching to alternative, existing solutions. They categorised the material as:
Removeable plastic: where the plastic content in an alternative solution (e.g. fibre, glass) is less than 1% by weight – including items sold loose or packaged with a minimal plastic coating or seal.
Reducible plastic: where plastic can be significantly reduced to less than 5% by weight – remaining recyclable within standard recycling processes.
In line with the rest of the analysis, the replaceable plastic figure was weighted by retailer market share and harmonised CPI weightings for each country.
B2B survey
A B2B survey was also conducted in June 2024 to gather insights from 300 food and drink industry professionals working in senior positions related to packaging or sustainability across the six countries.
1Unnecessary can be defined as replaceable plastic; plastic packaging that can either be completely removed or significantly reduced by switching to alternative materials. Replaceable plastic includes both removable plastic and reducible plastic, with the threshold for reduction being less than 5% plastic by weight, aligned with industry recycling standards.
2 Across six European markets: UK, France, Germany, Italy, Spain and Poland.
3 Figure includes all packaging that includes plastic components.


 Good progress has been made but there is more to do. Government can and should demand more of us all - phasing out certain plastics to create a level playing field that encourages innovation, investment, and generates healthy competition to replace plastic.